See a Sample Investment Report
 Cash Flow
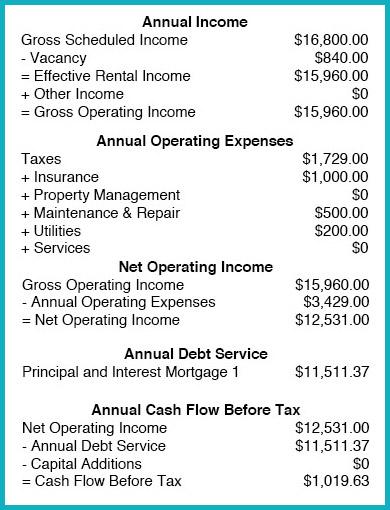
Annual cash flow is the most basic and commonly used method to evaluate a buy and hold investment. Rates of return are important, but if you can’t sustain the monthly cash flow or loss, then the investment still doesn’t make sense. Remember this is all calculated on an annual basis. To the left is an example of a cash flow analysis.
Gross Rent Multiplier
The GRM method is used to help determine investment value. It is quick and easy but is only useful when comparing one property against another. It also doesn’t take into account vacancy rates, operating expenses, debt service, tax impacts or income past the first year.
GRM = Asking Price / Gross Annual Income
For example, if a single-family home rents for a gross of $1200/mo this would be a gross scheduled annual income of $14,400. Let’s say the asking price is $160,000. The following calculation will determine the GRM: 11.1 GRM = $14,400 / $160,000
You can also go backward to land at the value of the investment property based on the gross scheduled annual income. This is helpful if you have a particular target GRM that you are using to compare to.
Gross Annual Income x GRM = Value of the Investment Property
Now, if there were a property that you knew would rent for $1500/mo or $18,000 gross annual scheduled income, and you wanted to know how much it would be if the same GRM were used, then the following applies: $18,000 x 11.1 = $199,800 Investment Value
Capitalization Rate (CAP Rate)
A CAP rate is a ratio between the first-year net operating income (NOI) and the purchase price. Cap rates are specific to each market and can vary greatly. It is a good method to use to compare properties or to set a standard for your investments. The formula is as follows:
CAP Rate = Net Operating Income (NOI) / Purchase Price
For example, a property with an income of $1500/mo and annual expenses of $3000 has an NOI of $15,000. This number is gross annual income minus expenses, but not including debt service. With a purchase price of $200,000, the cap rate is figured: 7.5% CAP Rate = $15,000 / $200,000
Cash on Cash Return
This method compares the investor’s original initial cash investment to the potential before-tax cash flow that the property is likely to produce. This method takes into consideration vacancy rates, operating expenses, and debt service. It does not take into consideration anything past the first year or account tax considerations. The formula would be as follows:
% Return = Before-Tax Cash Flow / Initial Investment
For example, if you put down $40,000 on a $200,000 property with the seller paying the closing costs. If your annual Before-Tax Cash Flow is $4,000 then the equation would look like this:
10% Cash on Cash Return = $4000 / $40,000
Debt Coverage Ratio
The method is commonly used to analyze a property with more than 5 units which would normally qualify for a commercial loan. Lenders will use this as a guideline when reviewing your loan application. It is determined by dividing the Net Operating Income (NOI) by the annual Debt Service. Reference the above Cash Flow example to determine how to figure any numbers.
Debt Coverage Ratio = Net Operating Income / Annual Deb Service